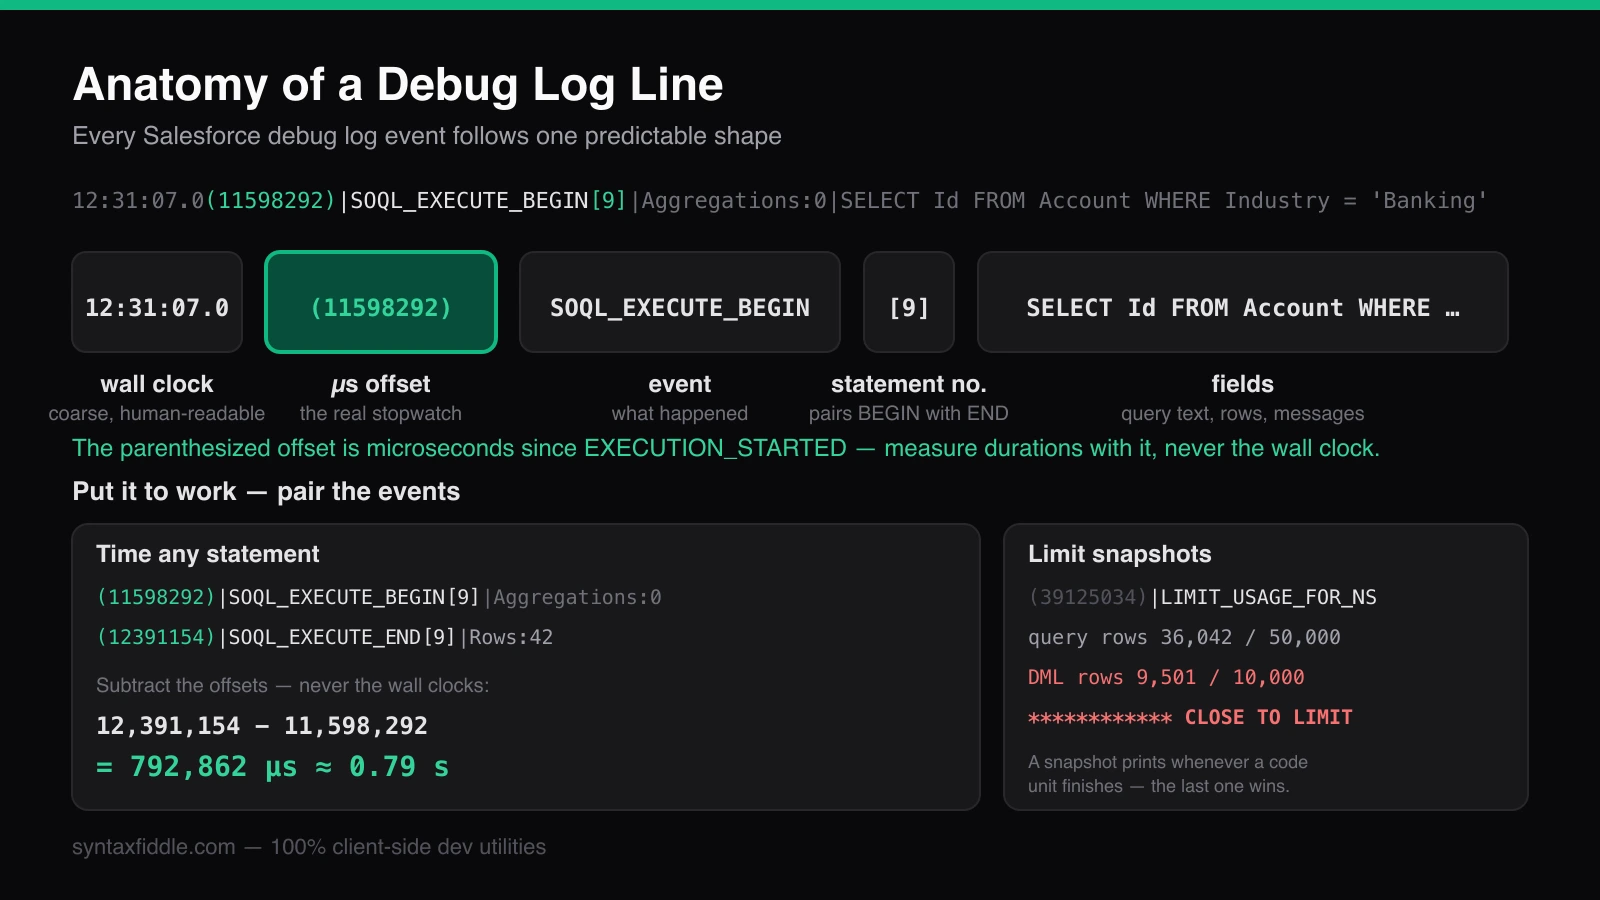
A Salesforce debug log records everything your Apex code did in one transaction: every query it ran, every record it touched, every governor-limit snapshot it passed, and every exception it hit — timestamped to the microsecond. That makes it the single most useful artifact for debugging performance problems. It also makes it dense: a single bulkified trigger can produce tens of thousands of lines. This guide teaches you the grammar of those lines so the log reads like a story instead of noise.
Try it while you read
Salesforce Debug Log Analyzer — Parse debug logs — SOQL, DML, governor limits & errors.
Capturing a debug log
Three everyday routes produce a log:
- Trace flags. In Setup, search for Debug Logs and add a trace flag for
your user, then reproduce the action. The Apex Code level controls volume —
DEBUGis a good default;FINESTadds query plans and heap detail but fills the cap much faster. - Developer Console. Every Apex execution the console runs generates a log, visible in its Logs tab and downloadable as plain text.
- Automated process logs. Batch jobs, future calls, and Queueables write logs of their own — check the Apex Jobs page for their IDs first.
Two caps shape everything: a log stops at 20 MB (the platform replaces the omitted middle with a truncation marker you will learn to recognize below), and logs expire after 24 hours — export anything you may want to compare later.
Anatomy of a debug log line
Every event line follows one shape:
12:31:07.0 (11598292)|SOQL_EXECUTE_BEGIN[9]|Aggregations:0|SELECT Id FROM Account WHERE Industry = 'Banking'
| Segment | Meaning |
|---|---|
12:31:07.0 | Wall-clock time, at tenth-of-a-second granularity |
(11598292) | Microseconds since EXECUTION_STARTED — the real stopwatch |
SOQL_EXECUTE_BEGIN | The event name — what happened |
[9] | Statement sequence number within the transaction |
| Remaining fields | Event-specific: the query text, row counts, messages |
The parenthesized offset deserves emphasis: wall-clock ticks are too coarse to
time anything shorter than a tenth of a second, but the microsecond offset is
monotonic. To measure how long a query took, subtract the offset of its
SOQL_EXECUTE_BEGIN from its SOQL_EXECUTE_END — that is exactly what a good
debug log analyzer does for every statement in the file.
The events that matter
Dozens of event types exist, but a handful answer most questions:
| Event | What it tells you |
|---|---|
EXECUTION_STARTED | The transaction began; offsets reset here |
CODE_UNIT_STARTED/FINISHED | One entry point: a trigger, class, or anonymous block |
SOQL_EXECUTE_BEGIN/END | A query ran; the END carries its returned row count |
SOQL_EXECUTE_EXPLAIN | The query plan — watch for TableScan markers |
SOSL_EXECUTE_BEGIN/END | A search ran, with result counts |
DML_BEGIN/END | A write: operation, object, and row count |
LIMIT_USAGE_FOR_NS | Governor-limit snapshot for one namespace |
USER_DEBUG | System.debug output, tagged with its logging level |
EXCEPTION_THROWN | A caught or uncaught exception, with the Apex line |
FATAL_ERROR | Execution-ending failure, followed by stack frames |
CALLOUT_REQUEST | An HTTP callout left the org |
CODE_UNIT_STARTED/FINISHED are worth a second look: they fence off each
entry point, so counts inside one fence belong to that trigger or class — the
quickest way to attribute load to a specific piece of code.
Reading governor limits in the log
Whenever a code unit finishes, Salesforce prints a snapshot:
12:31:07.2 (39125034)|LIMIT_USAGE_FOR_NS|(default)|
  Number of SOQL queries: 4 out of 100
  Number of query rows: 36042 out of 50000
  Number of DML statements: 2 out of 150
  Number of DML rows: 9501 out of 10000 ******* CLOSE TO LIMIT
  Maximum CPU time: 3124 out of 10000
  Maximum heap size: 2198304 out of 6000000
Read used out of max on every line — the maximums matter as much as the
usage. The headline synchronous caps are 100 SOQL queries, 50,000 query rows,
150 DML statements, 10,000 DML rows, 10 seconds of CPU time, and 6 MB of heap;
asynchronous contexts roughly double several of them. The log always declares
the maximums that actually apply to its transaction, so trust the file over
any cheat sheet.
The ******* CLOSE TO LIMIT suffix is Salesforce flagging a limit that is
closing in on its cap. Also remember that managed packages own a separate set
of limits: their snapshots appear under their own namespace instead of
(default), which is how a runaway AppExchange app stays invisible until you
look for it by name.
Spotting N+1 queries in Apex
The most expensive pattern a log can reveal is a query inside a loop — one execution per record, N plus one queries where one would do. The log signature is unmistakable: the same query text appearing again and again, often with only a filter value changing between iterations.
12:31:07.0 (14730946)|SOQL_EXECUTE_BEGIN[10]|SELECT Id FROM Contact WHERE AccountId = '001xx1'
12:31:07.0 (15519716)|SOQL_EXECUTE_END[10]|Rows:1
12:31:07.0 (15718390)|SOQL_EXECUTE_BEGIN[11]|SELECT Id FROM Contact WHERE AccountId = '001xx2'
12:31:07.0 (16509572)|SOQL_EXECUTE_END[11]|Rows:3
The fix is bulkification: gather the varying values first, then run one query
with an IN bind and index the results.
// Before: one query per account (N+1)
for (Account acc : accounts) {
    acc.Contacts = [SELECT Id FROM Contact WHERE AccountId = :acc.Id];
}

// After: one query for all accounts
Map<Id, List<Contact>> byAccount = new Map<Id, List<Contact>>();
for (Contact c : [SELECT Id, AccountId FROM Contact WHERE AccountId IN :accountIds]) {
    byAccount.get(c.AccountId).add(c);
}
You can count repeated shapes by eye on small logs, but on a real capture the
Salesforce debug log analyzer does it
algorithmically — it fingerprints query structure with literals masked out, so
WHERE AccountId = '001xx1' and WHERE AccountId = '001xx2' collapse into one
flagged shape with an execution count.
Truncation: when the log is incomplete
When a capture outgrows its cap, Salesforce keeps the head, skips the middle, and resumes near the end:
*** Skipped 4194304 bytes of detailed log due to log size limit ***
Everything between those markers was never recorded. Any total you compute —
query counts, DML rows, exceptions — is a lower bound, and the final
LIMIT_USAGE_FOR_NS snapshot may not reflect the true end of the transaction.
If you see the marker, lower your trace-flag levels or narrow the capture
window and reproduce, rather than drawing conclusions from partial data.
Reading logs without the eye strain
Manual reading works for ten-line snippets. For a real capture, the workflow that scales is: drop the log into the debug log analyzer for the aggregated view — grouped queries with durations, per-namespace limit snapshots, extracted exceptions — then jump back into the raw file at the physical line numbers it reports. When you are iterating on the fix, the SOQL formatter keeps rewritten bulkified queries readable, and the rest of the Salesforce tools cover the JSON-to-Apex and SOQL-building steps of the same workflow.
Frequently asked questions
Where do I find debug logs in Salesforce? Setup → Debug Logs — add a trace flag for a user, reproduce the action, and download the generated log. The Developer Console's Logs tab is the fastest route for anonymous Apex.
What does the number in parentheses on every line mean?
Microseconds since EXECUTION_STARTED. It is the transaction's stopwatch:
subtract two offsets to time anything precisely.
Why did Salesforce skip part of my log? The capture hit the 20 MB size cap. Salesforce keeps the head and tail and records a skip marker in the middle — the omitted events are gone for good, so reproduce with lower trace levels.
How do I find the slowest query in a log?
Pair each SOQL_EXECUTE_BEGIN[n] with its SOQL_EXECUTE_END[n] and subtract
the microsecond offsets; the widest gap wins. The analyzer computes this for
every statement and sorts by total rows and slowest duration automatically.